Weekly Forecasts 24/2026
What does the co-movement of the price of gold and the S&P 500 imply?

Contents:
The price of gold and the U.S. stock market exhibit co-movement.
Stochastic trends driving prices of gold and silver and the S&P 500.
Forecasts and scenario forecasts for the price of gold, the price of silver, and the S&P 500.
This week, we tackled a research question posed by my partner in the investment company we founded this week. I’ll write more about it when the legal proceedings are completed and the company is fully registered. However, as I have noted a few times, the launch of the investment company will turn our forecasting activity toward the markets. This change is also something some of you have asked for.
The question we took upon analysis was, are the gold price and the U.S. stock market driven by the same market forces, most notably liquidity? This question naturally cannot be answered in any depth within just one research paper (and 10 pages), but we can accomplish a good first look at the topic.
Our results imply that this could be the case. That is, there appears to be a joint stochastic trend driving both the price of gold and the S&P 500. At this point, it is impossible to assess with any clarity whether this trend is “liquidity.” It is also somewhat irrelevant from the standpoint of statistical forecasting (emphasis on the word “somewhat”).
Our forecasts indicate that the price of gold should start to recover, but to be honest, so it has a few times. Whether this time is different remains to be seen. However, the forecasted paths of the price of gold, silver, and the S&P 500 seem to already follow a trajectory of a still-mild oil crisis.
Tuomas
Gold and the U.S. stock market
What we have started to ponder is how big of an effect liquidity has on the price of gold. This led us to the question: What is the relationship between gold and the U.S. stock market (the S&P 500)? Something of a surprise awaited us there.
Figure 1 presents the time series of the monthly price of gold and the S&P 500 stock market index.
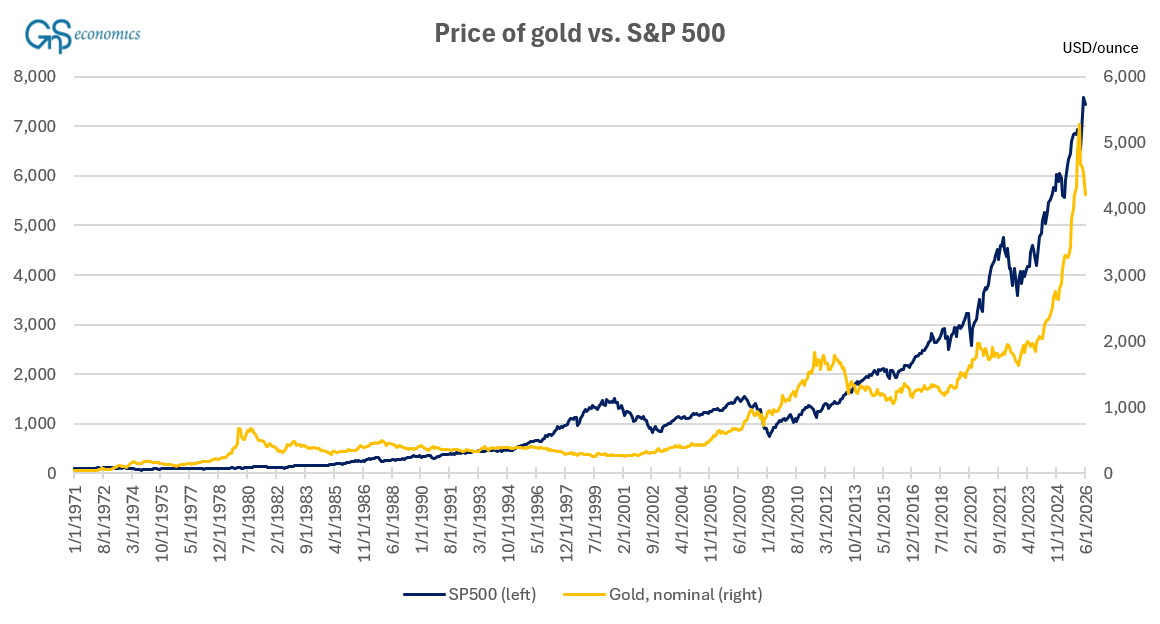
The co-movement of the series was striking, and something of a surprise to us. This becomes better visible when we take natural logarithms from the two series, which are presented in Figure 2.
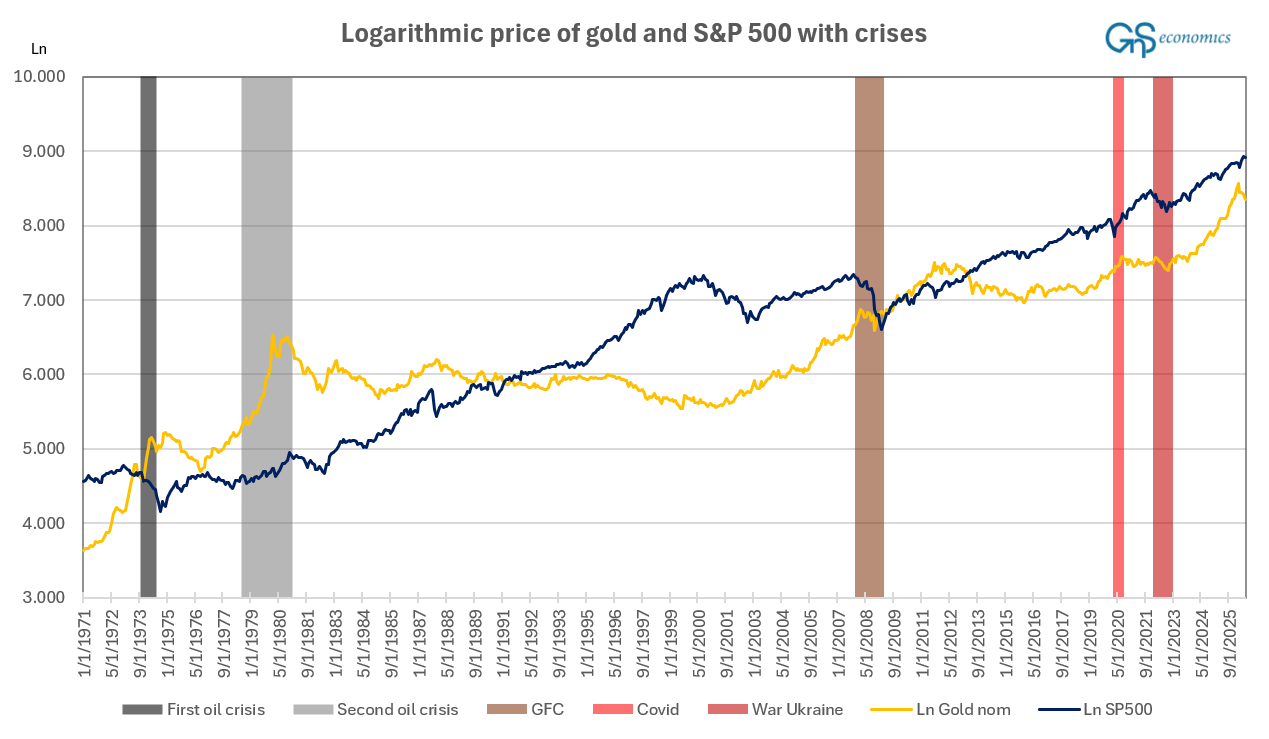
The price of gold rises notably going into the first oil crisis, but this is mostly driven by the collapse of the Bretton-Woods System, which restricted the movements in the price of gold. In the second oil shock, the price of gold was already mostly dictated by the market forces,1 and there we see a “safe haven style” of rise the deeper the world entered into the crisis. We end our dummy variable of the second oil shock in December 1980, while the U.S. interest rates peaked at 19.08% (the effective rate) in January 1981, driven by the extremely hawkish stance of the Fed Chair Paul Volcker. Notably, the price of oil peaked just before our dummy ended, implying that gold investors anticipated rate cuts approaching (inflation had started to cool in May and June 1980). But could it imply something else too?
Unsurprisingly, the S&P 500 fell into the second oil crisis, but it still grew during the crisis. It’s a feature of stock markets to increase in value in an inflation crisis, which the oil shock naturally caused. We do not go into the details of this process now, but you can find more in Prepper’s Bunker.
Interestingly, during the first Corona lockdowns, the S&P500 fell while gold rose, but during the first months of the Russo-Ukrainian War, both fell at first. Now, while stock markets started their recovery in early April and have recently reached new all-time highs, the price of gold has started to recover only recently.
What is also shown in Figure 2 (remember that logarithmic values present a growth path) is that the prices of gold actually fluctuate a lot more than the S&P 500 index. This is a somewhat surprising result, at least to those who advocate gold as a safe haven (stable). In other words, the natural logarithmic transformation of the gold price and S&P 500 shows that, historically and outside crises, you have gained a more stable flow of profit (based on asset valuations only) from the U.S. stock markets than gold (note that our figure lacks a dummy for the bursting of the Dot-com bubble in the early 2000s).
Thus, figures 1 and 2 present us with an intriguing research question. Are the prices of gold and the S&P 500 driven by the same underlying factors?
The recent collapse in the price of gold has raised speculation that liquidity factors, for example, could affect gold prices in a manner similar to their impact on the stock markets. This argument may have some merit if we consider how the logarithmic price of gold behaved during the GFC (it rose before the crisis and then stagnated). If so, this would imply that A) the two variables should be driven by a joint stochastic trend (of liquidity, etc.) and B) the inclusion of this statistical equilibrium (cointegration) relationship should improve the forecasts of both series. Let’s begin by checking the first assumption.
Stochastic trends in gold, silver, and the S&P 500
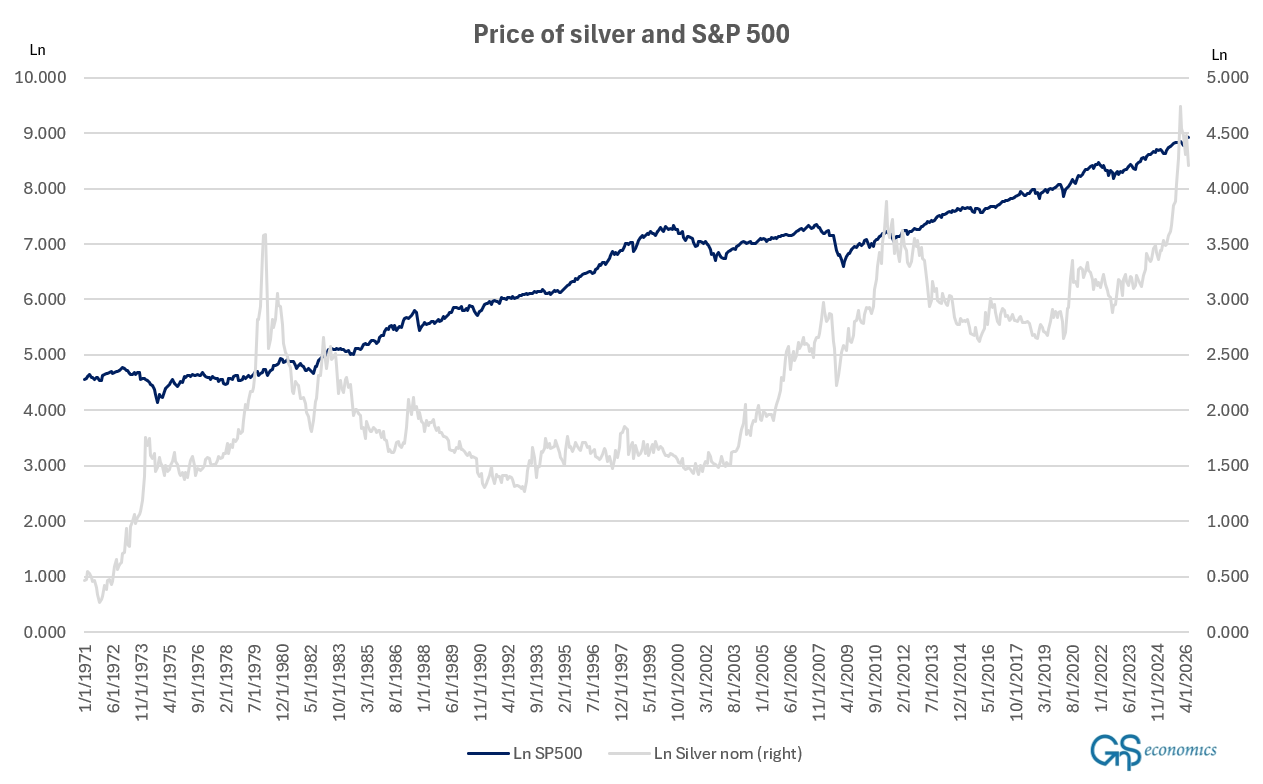
We have to say that this was rather fascinating research to conduct. The conclusion we ended up with is that there’s a joint stochastic trend driving the price series of gold and S&P 500, but such an equilibrium relationship would not exist between silver and S&P 500. The first hint to the latter conclusion comes from a simple visual inspection of the natural logarithms of the S&P 500 and the price of silver depicted in Figure 3.