
Weekly Forecasts 18/2026
The European economy looks ready to fall

Contents:
Economic indicators indicate a collapse approaching the Eurozone and Beijing resorting to major stimulus, again.
Updates for forecasts for U.S. GDP in three scenarios: oil crisis, oil + financial crisis, oil + financial crisis + supply chain collapse.
We have not updated the economic indicators since mid-February. This is mostly because of the internal turmoil that hit our company in late February and because the structure of Weekly Forecasts has been somewhat unclear. Now I see that the correct structure has finally started to manifest. It will take some still, e.g., because I am actively seeking to expand our contributor base, but we’ll get there.
This week, we establish what will be a permanent section in our Weekly Forecasts. We’ll update the economic indicators for China, the Eurozone, and the U.S. In addition, we update the scenario forecasts for U.S. real gross domestic product.
In the future, this section will also provide forecasts for the Eurozone GDP. This has been our long-standing aim, which has just gotten postponed. This week, one of our paid subscribers wrote to me in hope of seeing scenario forecasts also for Europe. This pushed me into action, but the Eurozone data has proven to be rather complex to analyze. I may report something about it next week.
The uniform message of this week’s forecasts is that sh*t is about to hit the fan of the global economy. Economic indicators are flashing signs of impending economic hardship, while our forecasts continue to anticipate challenging times for the U.S. economy. The global economy is approaching a precarious period.
Tuomas
Economic indicators
United States, April (March)
Richmond Fed manufacturing: 3 (0)
Empire State manufacturing: 11 (0)
Dallas Fed manufacturing: 19 (7)
Kansas Fed manufacturing: 10 (11)
Manufacturing PMI: 54.5 (52.3)
Services PMI: 51.0 (49.8)
Consumer Confidence: 92.8 (92.2)
U.S. leading indicator; November (September): 97.3 (97.9)
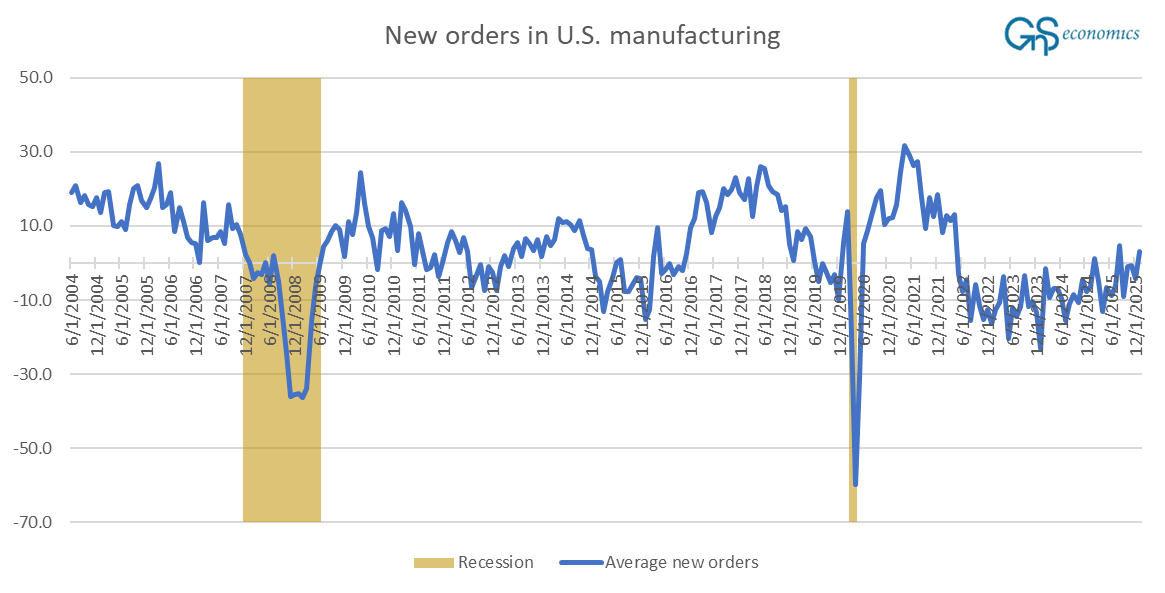
Manufacturing indicators improved quite notably across the board in the U.S. in March. Manufacturing PMI reached a high not seen since May 2022, a year that was also marked by war. The gradual improvement of the manufacturing sector is also visible in the new orders index of the sector.
Consumer confidence edged up, but the increase was miniscule in the grand scheme of things. The mood of U.S. households continues to hover in the depths of Corona lockdowns, while expectations continue to sink.

How we see the situation in the U.S. economy is that the domestic policies of President Trump have given something of a boost to it, which our forecasting model anticipated already in June. We consider the recent uptick in the manufacturing sector to have arisen from a war-related boost, as the government is increasing military spending while firms and households prepare for the approaching shortages. We expect this trend to accelerate to a point where the U.S. populace truly awakens to the dire economic consequences of the war. Based on the Services PMI, this has not happened yet.
Eurozone, April (March)
Manufacturing PMI: 52.2 (51.6)
Services PMI: 47.6 (50.2)
Germany ifo Business Climate: 84.4 (86.3)
The manufacturing PMI of the Eurozone continued strong in April, but the services PMI collapsed. The dive of the service purchasing managers’ index was the deepest since February 2021, i.e., during continued Corona lockdowns.
When interpreting manufacturing PMIs in the current predicament, it is important to consider that the supplier deliveries component is reported inversely. What this means is that longer delivery times appear as positive in the index because they are considered to signal a backlog in orders. However, if supply chain issues cause longer delivery times, like now, this sub-indicator generates a false positive signal. Therefore, in the current situation, services PMIs serve as a more reliable indicator of the economic condition, and they are declining in the euro area.
As a likely reflection of things to come, the Business Climate index of ifo Institute collapsed in April.
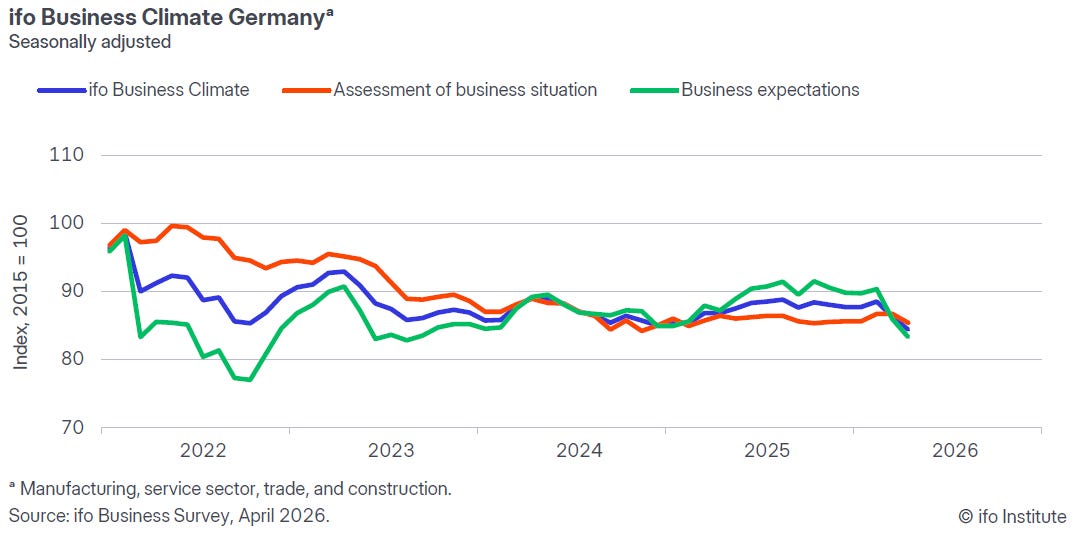
This collapse, most definitely, is war-related, but unlike in early 2022, not just expectations but also assessment of the current situation among German firms has collapsed. It is a sign that the German economy is about to enter a recession, followed most likely by the Eurozone, due to the supply chain issues stemming from the war in the Middle East.
China, April (March)
Caixin (RatingDog) manufacturing PMI: 52.2 (50.8)
NBS manufacturing PMI: 50.3 (50.4)
Caixin (RatingDog) services PMI: 52.6 (52.1)
China’s economic momentum looks positive in the light of PMIs. This is no surprise, noting the strong stimulus-push Beijing has enacted this year. The flow of aggregate financing to the real economy, depicted in Figure 4, has started this year in the vicinity of record flows.
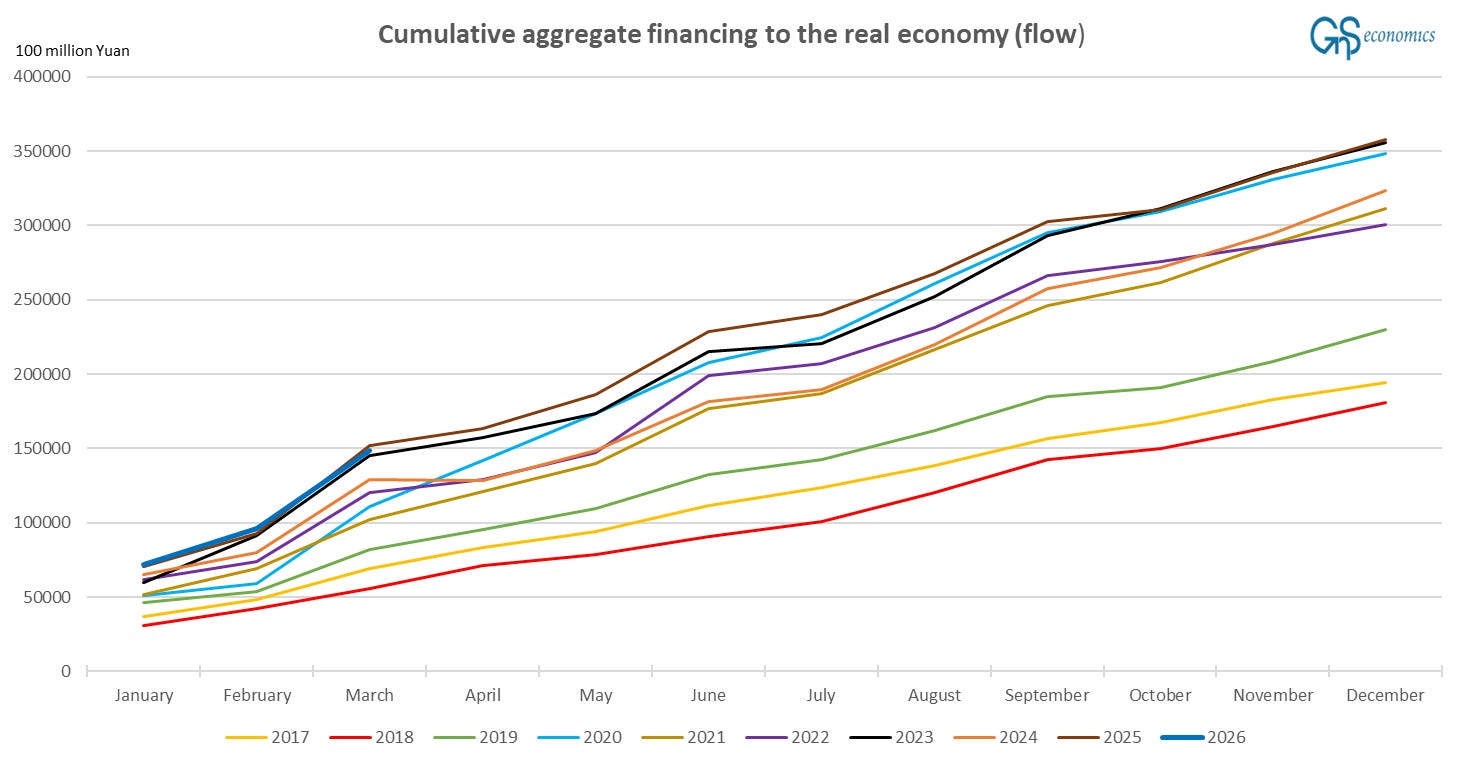
Like we noted in the April Black Swan Outlook, stimulus is likely to continue strong and even increase this year due to the approaching economic shock, which is already emerging in Europe (see above). This (implied) stimulus implies that China could become the best-performing major economy during this year.
That said, it is truly amazing how the command-and-control grip Beijing holds on the banking sector enables China to keep on building debt into the already massive debt pile. This is something that keeps on surprising us. Standard economic models lost their explanatory power a long time ago in the face of China’s semi-authoritarian economic model, which naturally complicates predictions about the sustainability of its debt levels and the potential consequences of the approaching financial crisis.
Some kind of day of reckoning is still approaching the Chinese economy, because there are limits on the level of debt any entity can hold. Let’s see whether the coming global crisis leads it to emerge.
Updated scenario forecasts for U.S. GDP
Now we have information which of our scenario forecasts performed the best for U.S. GDP during Q1 and the winner was… (drum-roll)… the scenario assuming an approaching financial crisis. This can be just a statistical coincidence and the first quarter of U.S. GDP can also change a lot in the second (and third) estimate, like we have seen recently. Thus, we should not make too much of the first estimate also forecasting-wise.
What is of interest to us, is how the emerging supply chain disruption and possible collapse, in the case the war continues and/or the closure of the SoH (Strait of Hormuz) drags on, affects the trajectory of U.S. GDP. We continue to approach this conundrum through scenario forecasting, by providing you with three updated forecasting scenarios: oil crisis, financial crisis, and supply chain collapse.
Figure 5 presents the results of our forecasting model assuming an oil crisis scenario.1
