
Weekly Forecasts 23/2026
Into another (worse) inflation shock?

Contents:
The U.S. inflation cools but remains elevated.
Forecast and scenario forecasts for U.S. inflation indices.
How will the war between Iran and Israel end?
This week, we’ll update our forecasts for U.S. inflation and speculate on how the war between Iran and Israel could end. The conflict has now entered another round of escalation, the heightened likelihood of which we warned about two weeks ago. Effectively, the fate of the U.S. and world economies ‘hangs in the balance’ once again.
We will first go through the latest inflation figures from the U.S. and reflect upon our models. This reflection leads us to return to the vector error correction, or VECM, model, simply because it has the best track record (thus far).
Our baseline forecasts indicate that even if the war ended now, U.S. inflation would remain elevated for the period of the next 12 months. Our scenario forecasts, assuming a deepening oil crisis and a re-worsening of the supply chain shock, paint an inflation crisis. As things currently stand, this outcome looks worryingly likely.
We end with speculation about how the war between Iran and Israel could end. We analyze this because the conflict between Iran and Israel is behind our current predicament. We see two endings to the conflict, whose implications for the world differ radically.
Remember our summer offer.
Tuomas
U.S. inflation cools but remains elevated
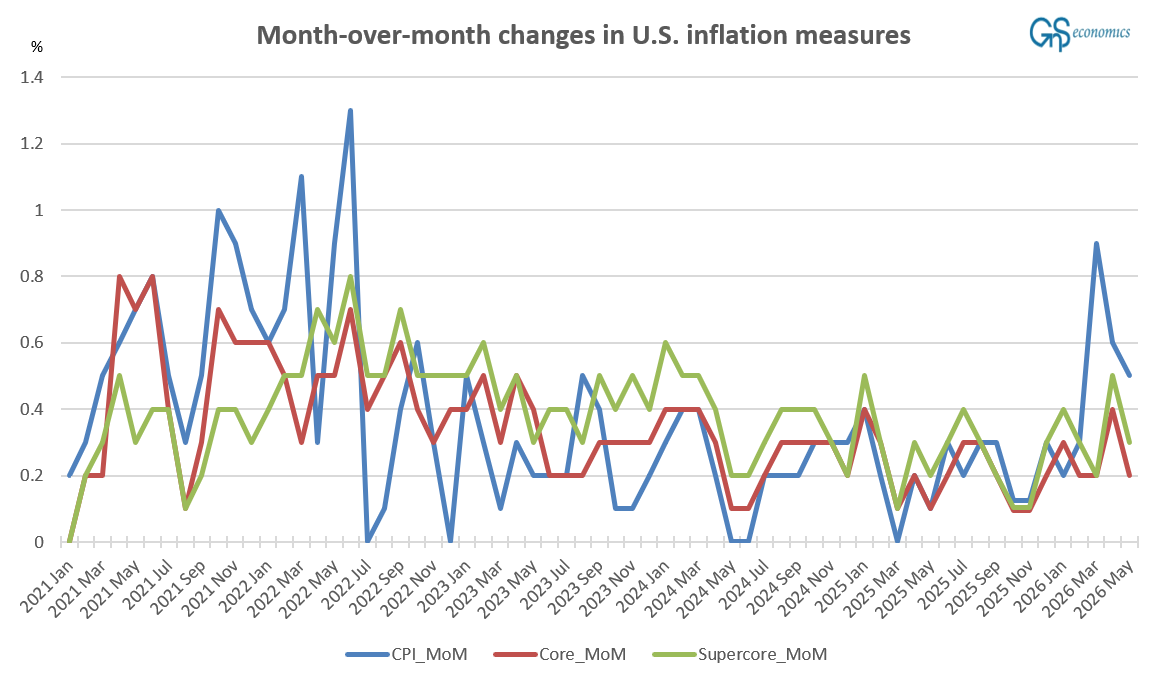
U.S. inflation, unsurprisingly, continued on its elevated trajectory, while the month-over-month (MoM) inflation cooled a bit. The Consumer Price Index (CPI) increased by 0.5% (from 0.6%), core inflation by 0.2%, and super-core inflation by 0.3% month-over-month. CPI was just like economists expected, while core inflation came in cooler. The annualized figures were 4.2%, 2.9%, and 3.4%, respectively.
Our last month’s forecasts were 0.3% (0.27) for CPI, 0.3% (0.27) for core, and 0.4% (0.39) for super-core. These were all rather clear misses even though our models did correctly anticipate the direction (cooling).
We are now in a position to assess the accuracy of different forecasting models we’ve been trying out. As you may remember, we have “flip-flopped” between vector autoregression, or VAR, vector error correction, or VECM, models. This has been due to our changing underlying assumptions regarding the statistical properties of the time series. VAR is used to estimate a system of stationary variables, while VECM is used to estimate (cointegrated) (I) non-stationary variables.
Last month we noted that:
Autocorrelation functions (not shown) of the three U.S. inflation measures, CPI, core inflation, and supercore, still show very high persistence, with the autocorrelation of, e.g., the MoM CPI series dying down only after 80 lags (months). It is the characteristic of a unit root series that the memory of the series is “infinite” or very close to it. This “infiniteness” is manifested in the autocorrelation function as a very persistent autocorrelation (that does not seem to “die out”). This is what the autocorrelation function of MoM CPI essentially shows. Moreover, the autocorrelation of core inflation does not fall under the 5% statistical significance even after 100 lags.
However, unit root tests reject the I(1) non-stationarity of all three series with a 5% level of statistical significance (but not at a 1% level of statistical significance). The Johansen Trace Test also indicates that all three series would be stationary.
In other words, statistical tests provide evidence to support both of the hypotheses, i.e., whether CPI, core inflation, and super-core inflation would be stationary or I(1) non-stationary. In such situations, it is best to rely on real-world observations (if they’re available). That is, to observe how the different model assumptions performed in forecasting the future path of the variables in question.
Figure 1 presents our (baseline) forecasts for U.S. CPI from March vs. the actualized values, which we found to have performed the best (out of the baseline models). The March baseline model, assuming no crisis, was (unsurprisingly) unable to forecast the major spike caused by the war in March, but its forecasts for April and May were very accurate.
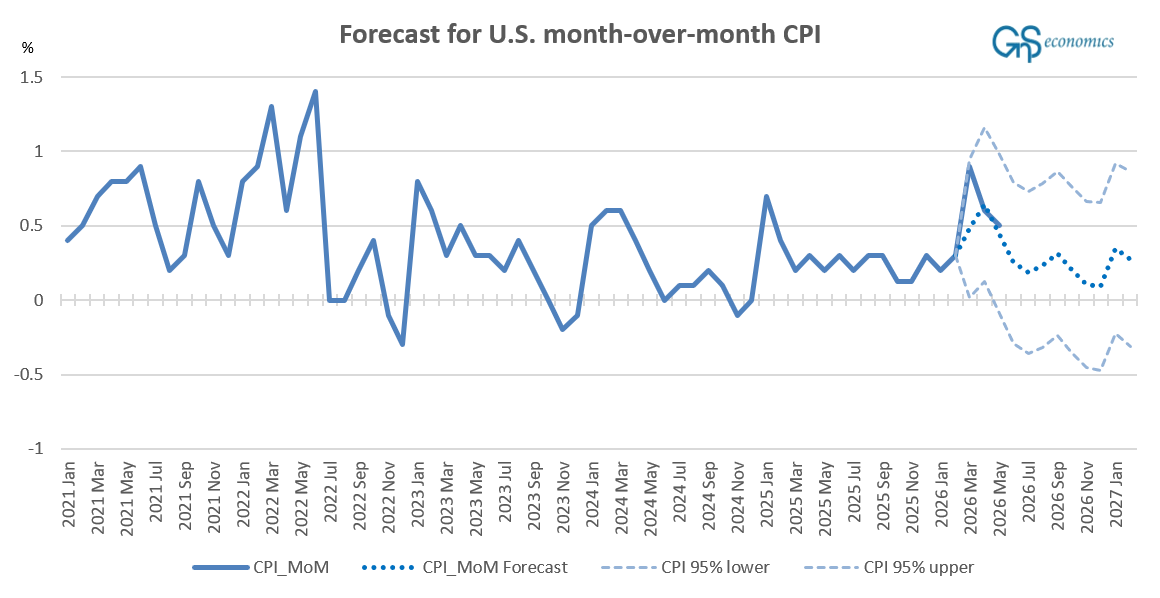
The problem we had with these forecasts was that they included an error. The CPI and core-inflation data changed from not seasonally adjusted to seasonally adjusted in 2025 (the exact month escaped from us). Despite this, the model was able to produce reasonably accurate forecasts, also short-term. While this accuracy may be just a statistical coincidence (driven by the error), we want to give the VECM modeling framework another go. Therefore, we used it to generate the forecasts presented below.
Outside modeling issues, it is now clear that U.S. inflation is picking up. It is (very) likely that the U.S. inflation will either stay at the current elevated level (if peace in the Middle East is found quickly) or re-accelerate (if not). Our forecasts below emphasize these two scenarios.
Forecasts for U.S. inflation
We now present two sets of forecasts for U.S. inflation. The first is a “baseline” forecast assuming no crisis. That is, the model does not include any crisis dummies. In the second set, we assume that the U.S. economy faces both a continuing oil crisis and a supply chain shock. The latter is a naturally more plausible scenario considering the renewed escalation in the Middle East. Figure 3 presents the forecasts for the three U.S. inflation measures produced by a VECM model.1
