Forecasts:
The plateauing of the leading indicators indicates an approaching peak in the business cycle.
Autocorrelation in statistical analysis.
More evidence showing China driving the global business cycle.
Forecasts point to two possible near-term outcomes: The world economy is about to enter a rapid contraction, or we are in a short-lived (shallow) boom followed by a slump.
This week we continue to analyze the leading indicators of the OECD. I think that we are closing in on a set of models that we can rely on. It has been a tumultuous road, and there are always new (statistical) roads to travel, because statistical analysis develops all the time. Nevertheless, I think we are at a point where we can start to rely on our forecasts (I hope).
This time we also want to deepen your understanding of autocorrelation, because it is a crucial concept in time-series analysis. We thus expand what we started in the June Outlook. We also analyze the relationship between leading indicators of China and the G-20 using impulse-response analysis.
We end this week's report with forecasts for leading indicators concerning the next 12 months. They indicate a global economic downturn approaching. We also introduce you to another uncertainty concerning time-series forecasts, namely, omitted-variable bias. It is a very difficult bias to tackle, for a multitude of reasons (obviously), but in this report we start to introduce it to you.
Tuomas
Has the leading indicator of the world peaked?
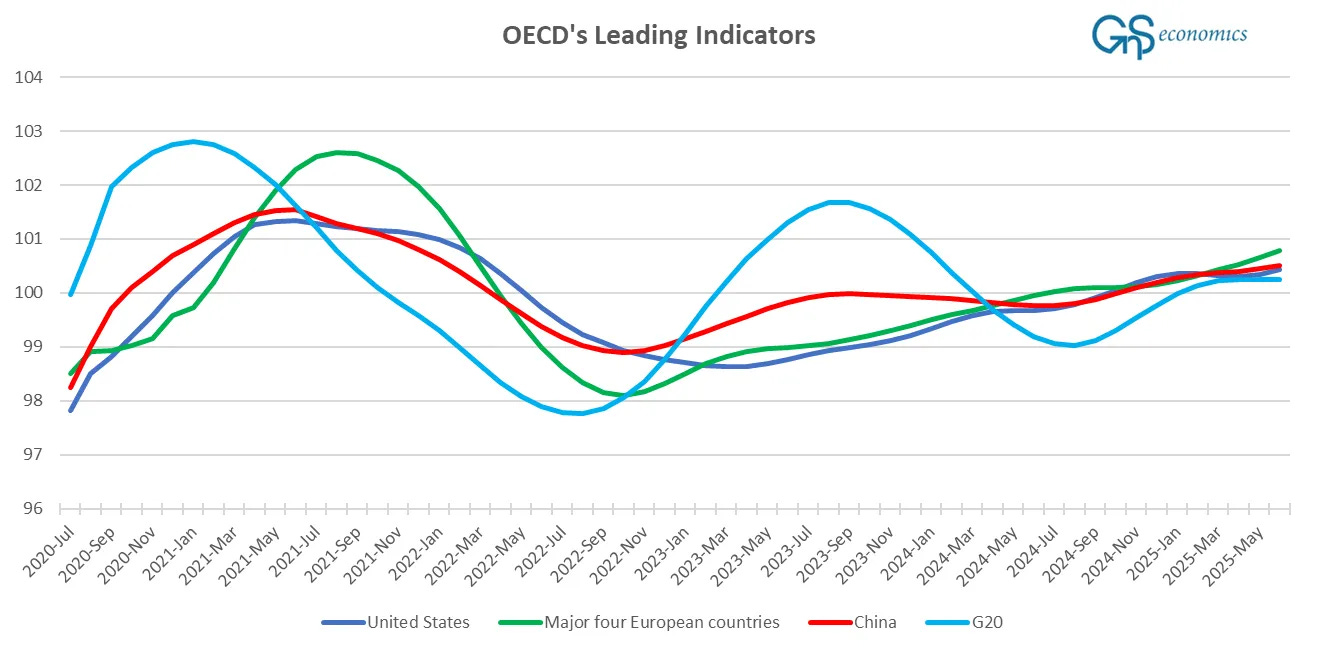
This is how the leading indicators of the OECD currently look.

At the end of June, our forecasts indicated that we would see an acceleration in all four indices. Effectively, this has been realized with the major four European countries (France, Germany, Italy, and the U.K.), while the leading indicator of the G-20 has stagnated.1 The indicator of the U.S. ascended in June as did that of China, but only modestly. What is interesting in the figure above is the “plateauing” of the leading indicator of the G-20, because it indicates that upward momentum of the index would have peaked. It has also been a rather shallow recovery from the previous business cycle slump a year ago. This quite straightforwardly implies that the world economy is running out of steam.
Autocorrelation in leading indicators
Autocorrelation describes the dependence of a variable on its history in the context of a time series. Positive or negative autocorrelation implies that observations of a variable in time t (now) are dependent on the lagged (past) values t-n, n=1,2,3…N. The next figures present the autocorrelation of OECD’s leading indicators for China and the G-20. The dotted lines in the figures represents the 95% level of statistical significance. That is, all observations above or below are deemed to show a statistically significant autocorrelation.
Keep reading with a 7-day free trial
Subscribe to GnS Economics Forecasting to keep reading this post and get 7 days of free access to the full post archives.


