
Weekly Forecasts 28/2026
A development and a primer to a breakpoint analysis in U.S. bank lending

Contents:
There has been a development in the U.S. bank lending.
We look for the (statistical) breakpoints in the U.S. bank lending series.
Forecasts indicate a slowing down of U.S. business lending, indicating an approaching downturn.
This week, we will begin a more in-depth analysis of U.S. bank lending data. We introduce you to the concept of breakpoint analysis and how it can affect the long-run dependency and cointegration relationship(s) between variables. Therefore, the will be a rather technical report, which is required for more robust future forecasts.
Before this primer on breakpoint analysis, we update the U.S. bank lending data. They indicate that the bailout of the private credit sector would be ending. Our forecasts add to the analysis by indicating a downturn in business lending and hence the U.S. business cycle ahead.
I also need to give you a heads-up about an announcement I am planning to give at the start of next week. Most likely, I will announce a pause in our services due to the inner upheaval our company is experiencing. I will provide our yearly subscribers with paid access to my newsletter for the duration of the pause. But let’s return to this at the start of the week.
Tuomas
A development
It now starts to look like our hypothesis on the bailout of the private credit sector was correct, based on recent updates to the U.S. bank lending data. On April 10, we noted that:
The private credit sector has been in the grips of a crisis, with, for example, massive withdrawal requests hitting the sector. Thus, we may have been witnessing a de facto bailout of private credit sector through bank lending. What we mean by this is that it is possible that major U.S. banks have been increasing lending to companies to pay off the loans acquired through credit funds (etc.) back to them. This is speculative, but the fact is that especially major banks are in the hook with the credit funds and other entities in the Private Credit space.
We speculated that this should lead the smaller U.S. banks to shy off from Private Credit, while major U.S. banks, who were deeply involved in the sector through the credit funds they created, would need to grow their lending to “bail out” the funds in trouble. With the latest patch of data, reaching the end of July, the trend is exactly what we have been seeing.
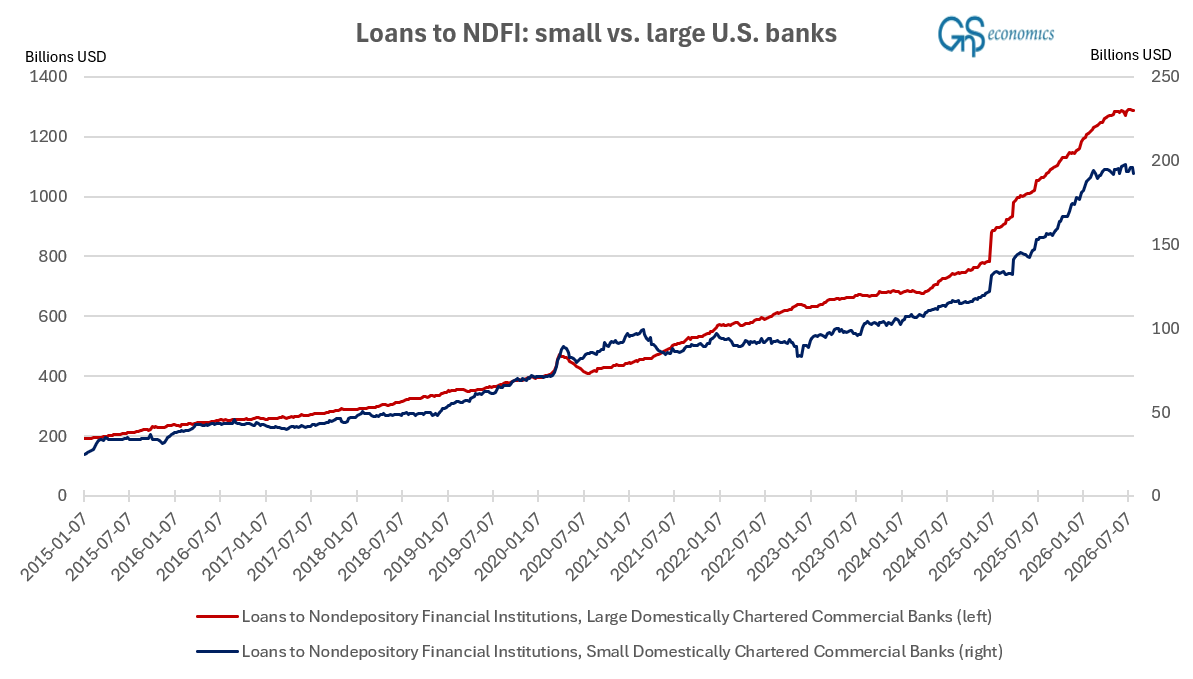
That is, the growth of lending by small banks to non-depository institutions (NDFIs) stalled in early March and has turned slightly negative during the past four weeks. Interestingly, also the lending by large banks to NDFIs has started to ebb, while it is also too early to say whether this is a hiccup or a clear break in the trend. However, on Monday, Tuomas noted that the bailout seems to have succeeded, at least as far as the stress in the repo markets is concerned. This is indicative that what we are seeing in the lending data reflects the end of the bailout, but does the observed change in the lending activity reflect something more?
When we observe the monthly business lending and lending to NDFIs, the (likely) changes in trends become more visible.
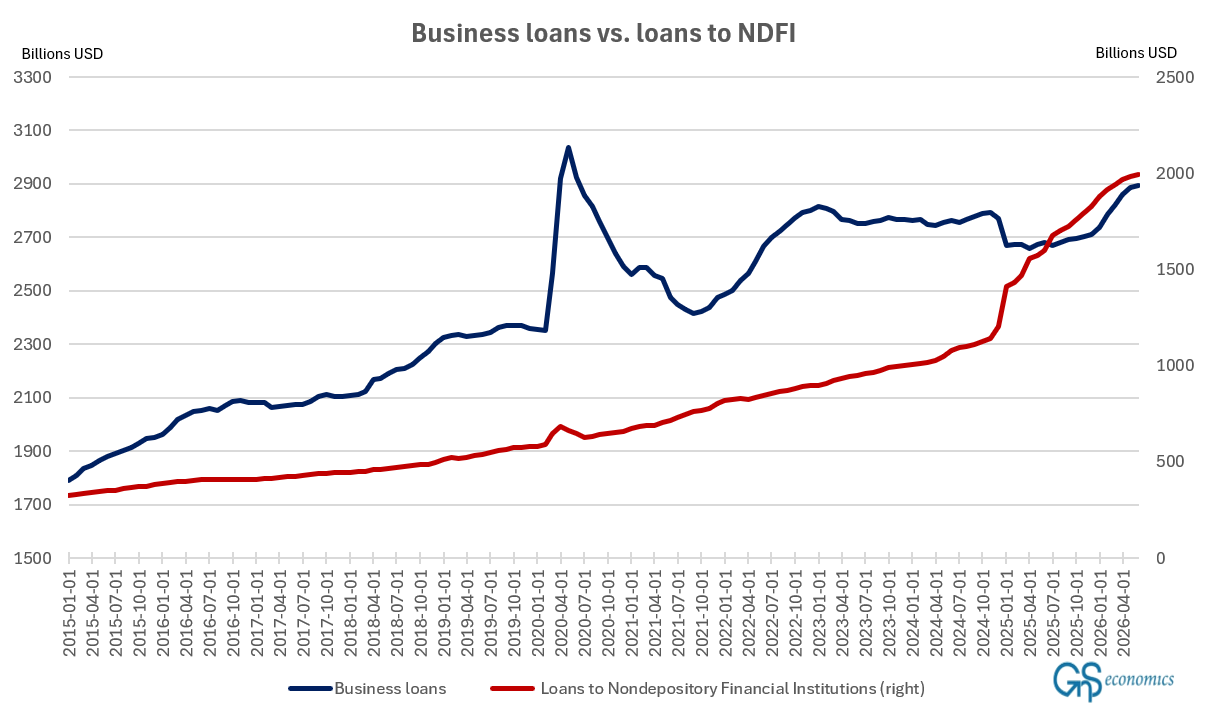
Based on Figure 2, both business lending and lending to NDFIs are slowing down, with business lending possibly peaking and turning down (our forecasts indicate that this would come; see below). These trends are indicative of a downturn approaching the U.S. economy. However, examining the annual growth rates of business loans issued by U.S. commercial banks reveals a different perspective.
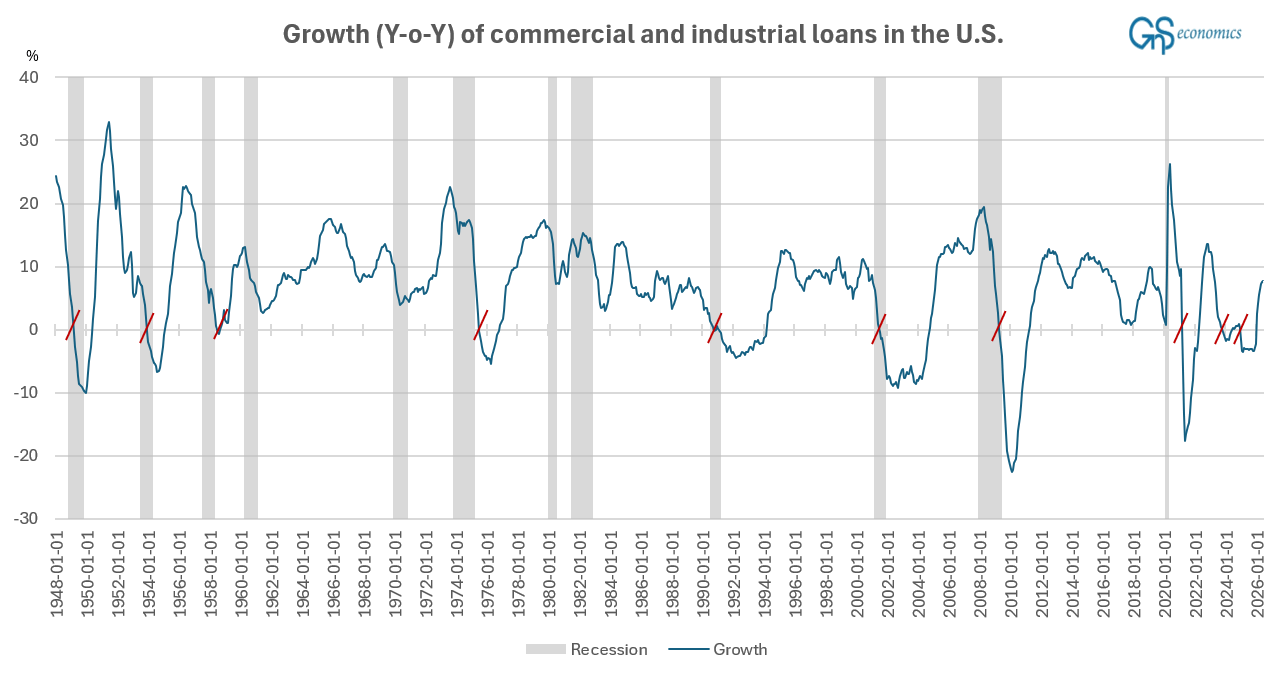
Annualized, the business lending by U.S. banks have seen a very strong increase during the past five months, while monthly growth rates have been falling heavily into the summer. Moreover, business lending of small banks is growing steadily, which is indicative of a robust growth in the SME (small and medium-sized enterprises) sector.
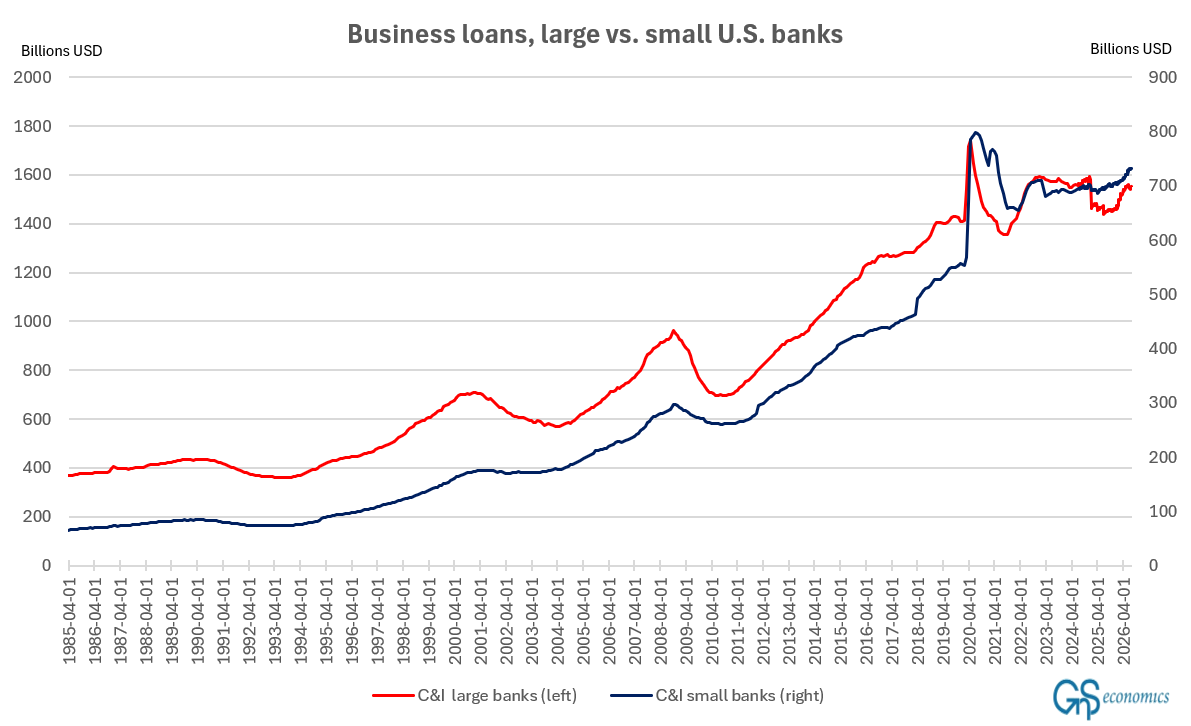
That said, we need to acknowledge that commercial and industrial loans issued by small U.S. banks have had the tendency to rise into a recession and even increase within a financial crisis before ebbing (this trend also applies to large banks). Figure 5 emphasizes the point.
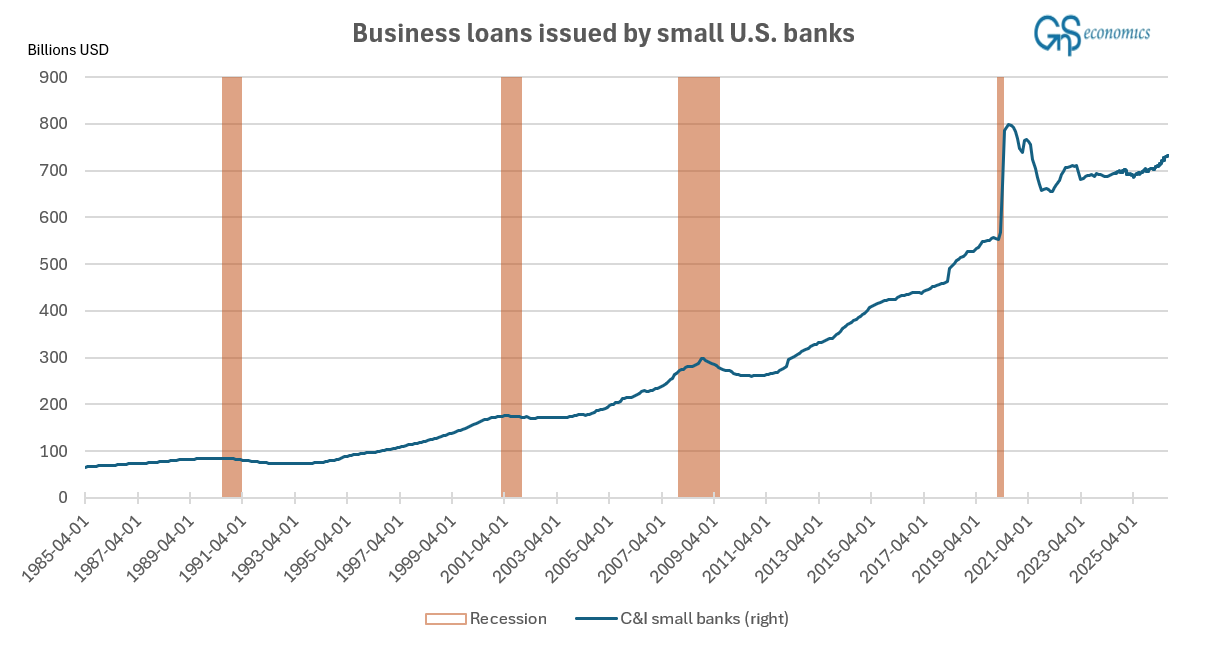
So, what can we make of the above, in addition to the bailout of the private credit sector by U.S. commercial banks, possibly closing its end?
Not much, really. The developments we list above may indicate a continued expansion of the U.S. economy or a recession approaching. To gain some more insights, we need to turn into forecasting.
Break points in the U.S. bank lending series
We now take up breakpoint analysis of the time series of U.S. bank lending (a feature available in EViews 14). The aim of this exercise is to improve the forecasts of US bank lending, which have suffered from forecasting model instability and exploding confidence intervals.
How the breakpoint analysis can help us in forecasting is by identifying the possible (likely) breaking points in the long-term (cointegration) relationship between our variables of interest. As you probably remember, cointegration analysis is about finding a stationary relationship between two or more I(1) nonstationary variables. Essentially, we are seeking linear combinations between two (or more) stochastic trends.
As you probably remember, shocks are naturally a defining feature of unit root processes, but what we are interested in are shocks that may alter the cointegration relationship(s) or “shake” it. This is because if there are breaks in the stationary (equilibrium) relationship between I(1) nonstationary variables, it affects forecasts and their confidence intervals (the error structure). It may bias the forecasts, but the shock, almost certainly, increases the mean squared errors, widening the confidence intervals, thus increasing the uncertainty of the forecasts. Moreover, if the shock breaks the stationary equilibrium relationship, the confidence intervals can start to exhibit “unit root behaviour,” i.e., explode. If we can identify and remove such one-time shocks, we will be able to produce more accurate forecasts (presumably).
That is why we turn to breakpoint testing with regard to the U.S. bank lending series. Bank lending is the driving force of the economy, as it fuelled the growth of small and medium-sized enterprises up until at least Private Credit started its phenomenal rise. This is actually one break point in the analysis that follows.
We explained the basics of breakpoint unit root analysis in Weekly Forecasts 26/2026. Essentially, we can have the test run statistics for two different assumptions about the break or an “outlier”. The first is called an additive outlier, while the second is called an innovative outlier. Simplified: the former tests for a break in the trend or slope of the series, while the latter tests for a break in the autoregressive dynamics of the series. The actual testing procedure is naturally (much) more nuanced, statistically.
